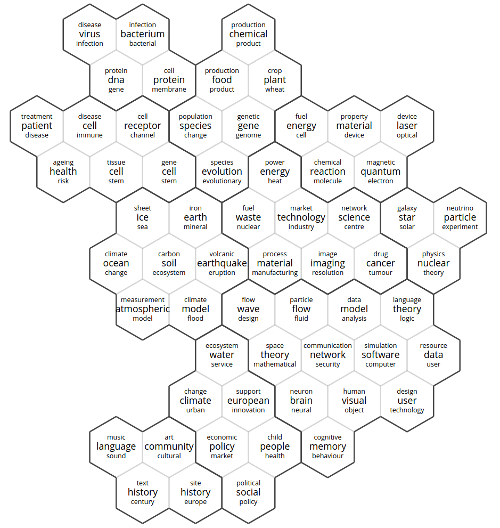
A Topic Map is a tool we developed to summarise any text portfolio in an structured visual layout. There are two facets to Topics Maps:
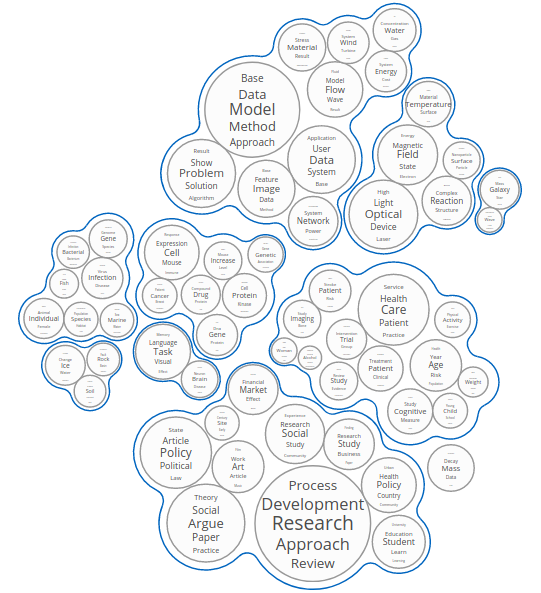
Extracting the topics from a collection of document is done without any supervision, using Latent Dirichlet Allocation1 (LDA). The only inputs necessary are the texts and the number of topics required. After the topic modelling process, we perform an additional algorithmic step to estimate similarities between topics. The final mapping process then uses that similarity information to place the topics on a map. We use our own algorithm to produce hexagonal grid maps (see below). Our bubble maps (see above) are inspired by Bubble Treemaps2.
1 Blei, D.M., Ng, A.Y. and Jordan, M.I., 2003. Latent dirichlet allocation. Journal of machine Learning research, 3(Jan), pp.993-1022.
2 Görtler J., Schulz C., Weiskopf C., and Deussen O., 2017. Bubble treemaps for uncertainty visualization. IEEE transactions on visualization and computer graphics 24, 1 (2017), 719–728.
COVID-19 Research
We modelled 15,000 publications to understand the impact and trends of the COVID-19 outbreak on research.
Research.Scot
This map shows a hierarchical thematic summary of the entirety of Scottish research, from 15 universities, since 2014.
9 Years of UK & EU Research
Inspired by Brexit, we used Topic Maps to compare British and European funded grants.